


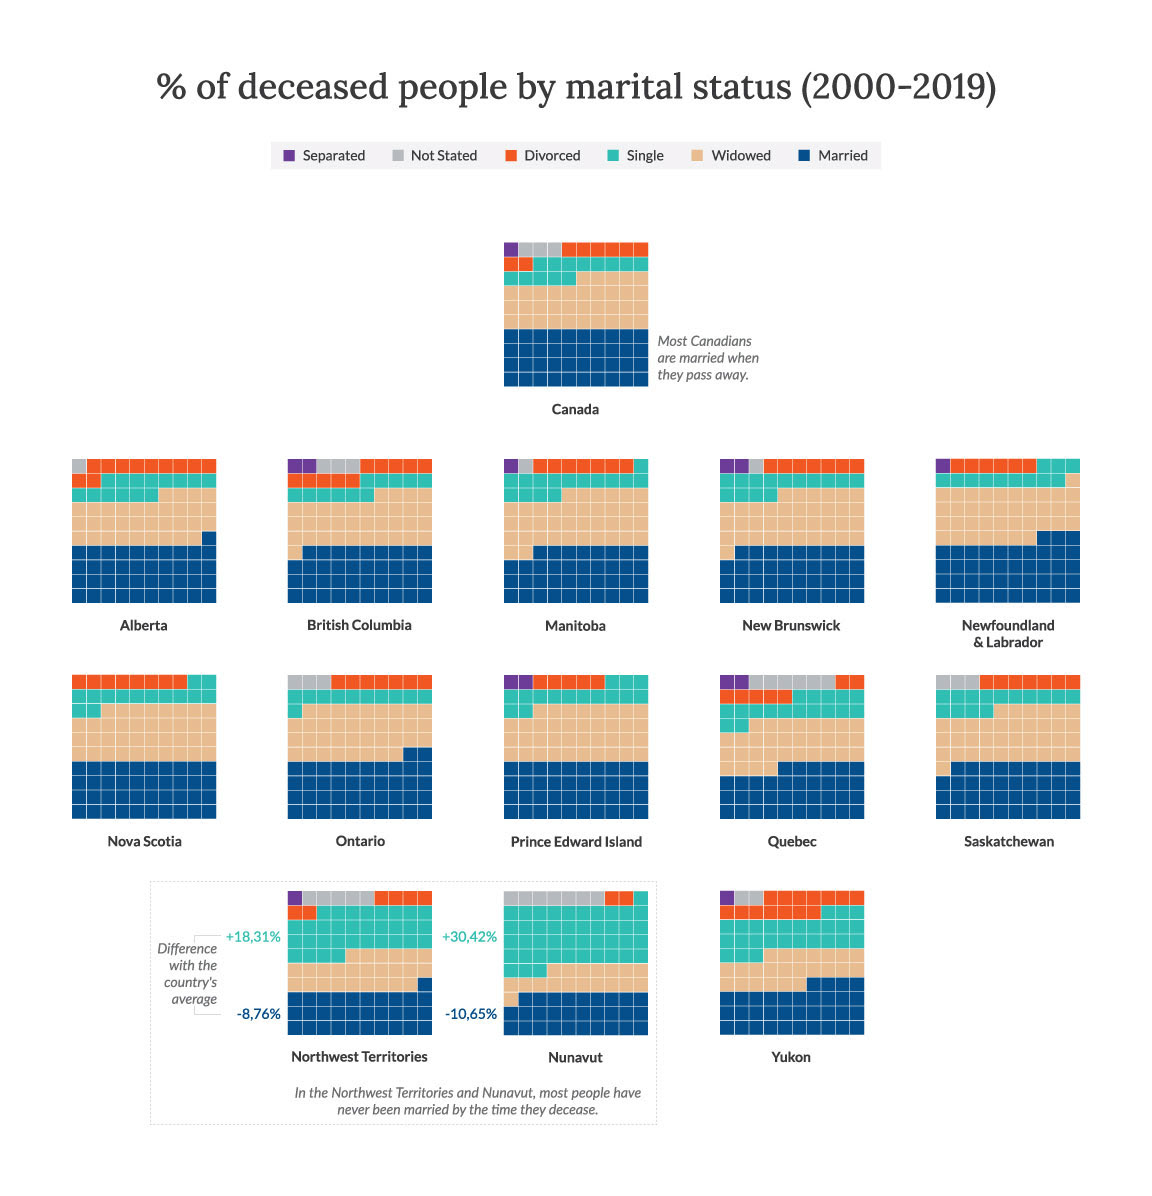
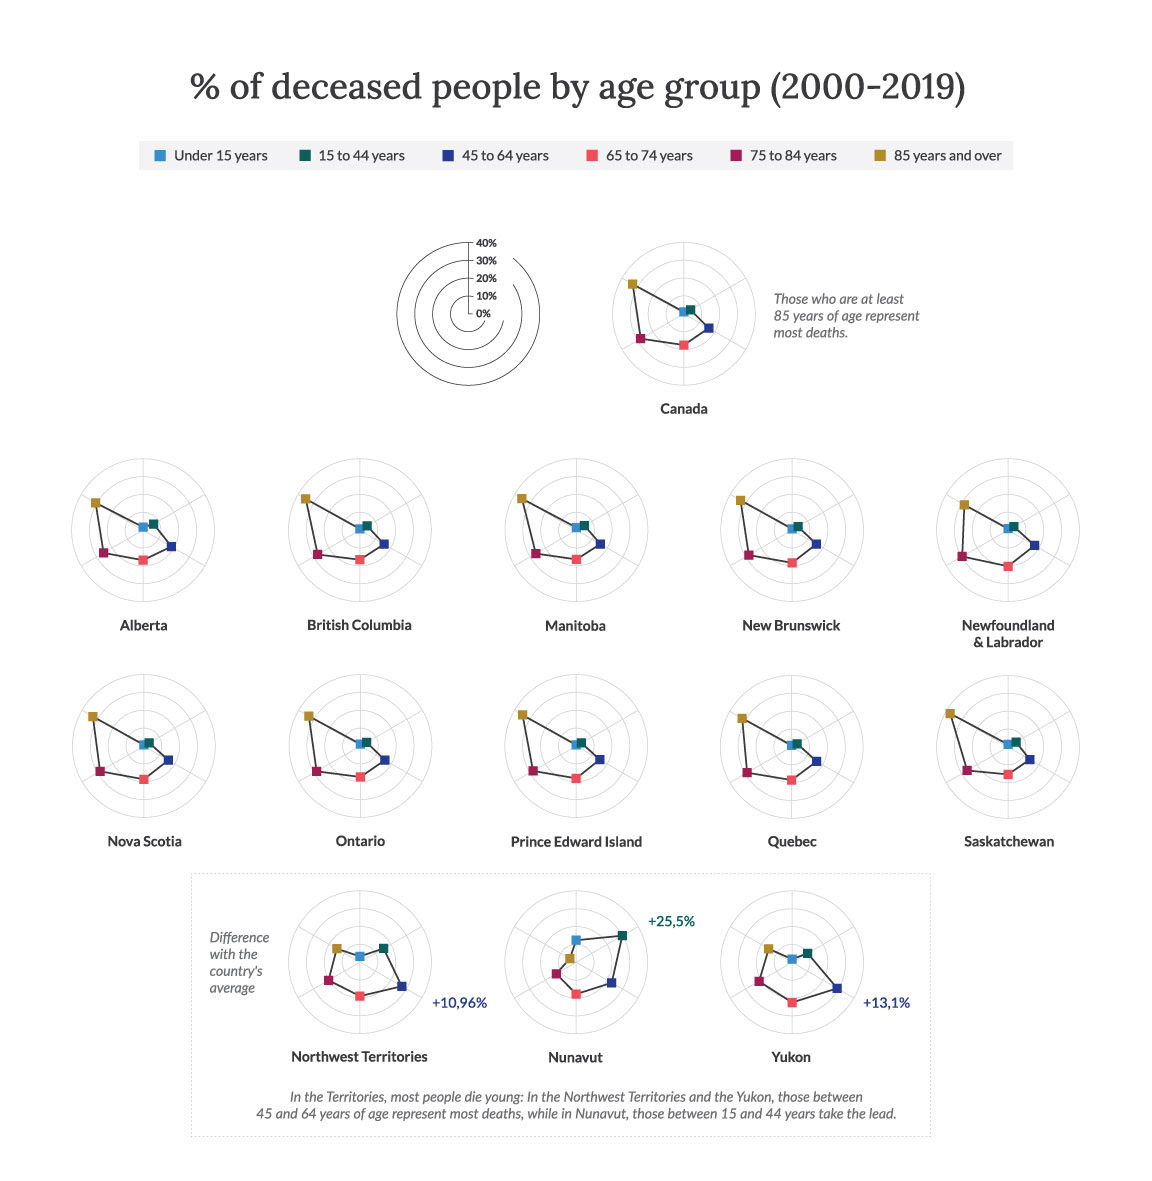
Created as a project for the course Information Design for Infographics & Visual Storytelling from Parsons School of Design, this visual essay explores the differences in deaths based on marital status and age groups across Canadian provinces and Territories.
Written from a Canadian perspective, this piece includes interactive visualizations based on data from the study Deaths, by marital status by Statistics Canada.
Readers can easily explore the significant contrast between the north and south of the country, as people in the Territories die at a significantly lower age.
Readers can easily explore the significant contrast between the north and south of the country, as people in the Territories die at a significantly lower age.

Language: English
Tools: Illustrator, HTML, CSS
Tools: Illustrator, HTML, CSS